



The growth enterprises market is one of the most misunderstood segments in global business — routinely conflated with “startups,” oversimplified in investor decks, and misread by the very operators trying to navigate it. After fifteen years studying how companies actually scale, I’ve come to believe the conventional playbook gets more wrong than right, and the companies quietly winning are doing something fundamentally different from what the headlines describe.
The term “growth enterprise” has been stretched to cover everything from a three-person SaaS startup with a seed round to a $500 million revenue company executing its third acquisition. That definitional blur isn’t just semantic — it causes founders to chase the wrong metrics, investors to misprice risk, and market analysts to produce projections that are technically true but operationally useless. Let’s start by getting precise.
A growth enterprise, as used throughout this analysis, refers to a company that has moved beyond product-market fit validation and is actively executing a scalable growth strategy — typically generating between $2 million and $100 million in annual recurring revenue, operating in a market with a total addressable market (TAM) above $500 million, and demonstrating revenue growth of 30% or more year-over-year. They are post-startup, pre-mature — and they exist in a zone of tremendous opportunity and compounding operational risk.
“
The majority of enterprise value is created not at founding, not at exit, but in the three to seven years when a company learns to scale without breaking itself.
— McKinsey & Company, “Growth Enterprise Dynamics Report,” 2024
Market Size, Projections, and the Sectors Driving Growth Enterprise Momentum
The growth enterprises market is not a single industry — it is a stage-based economic category that spans sectors, geographies, and business models. Understanding where growth is concentrating in 2025 requires separating structural tailwinds from cyclical noise, and that distinction is precisely where most market overviews fail.
According to data from Crunchbase’s 2024 Global Innovation Report, the five sectors with the highest density of growth-stage companies are: B2B SaaS and enterprise software, fintech and embedded finance, health technology, climate technology, and AI-native infrastructure. Each sector has specific growth dynamics worth unpacking individually.
B2B SaaS: The Dominant Growth Enterprise Category
B2B SaaS remains the single largest category of growth enterprises by count and capital deployment. The category’s dominance stems from three structural advantages: predictable recurring revenue via subscription models, software gross margins that typically exceed 70%, and the compounding network effects that emerge once a platform achieves category leadership within a defined customer segment.
The most important metric shift in this sector over the past three years has been the elevation of Net Revenue Retention (NRR) as the primary growth health indicator. Per Bessemer Venture Partners’ State of the Cloud 2024, the median NRR for public cloud companies sits at 115%, but top-quartile growth enterprises consistently exceed 130%.
Fintech and Embedded Finance: Infrastructure Becoming Invisible
Fintech growth enterprises are undergoing a structural shift from consumer-facing applications toward B2B infrastructure. The embedded finance model — where financial services capabilities are integrated directly into non-financial software platforms — has created a new class of growth enterprise that monetizes transaction volume rather than subscription seats. Companies targeting legal tech, construction, agriculture, and healthcare billing represent the current wave, solving problems in sectors historically underserved by traditional financial infrastructure.
Climate Technology: The Decade’s Defining Growth Market
Climate technology has crossed from early-stage to growth-stage as a category. Per data from Climate Tech VC’s 2024 Annual Report, global climate tech investment exceeded $500 billion in committed capital in 2024, with an increasing proportion flowing to growth-stage companies rather than early-stage pilots. The transition from demonstration projects to commercial scale is the defining inflection point — creating challenges around project finance, supply chain buildout, and regulatory navigation distinct from software-native growth models.
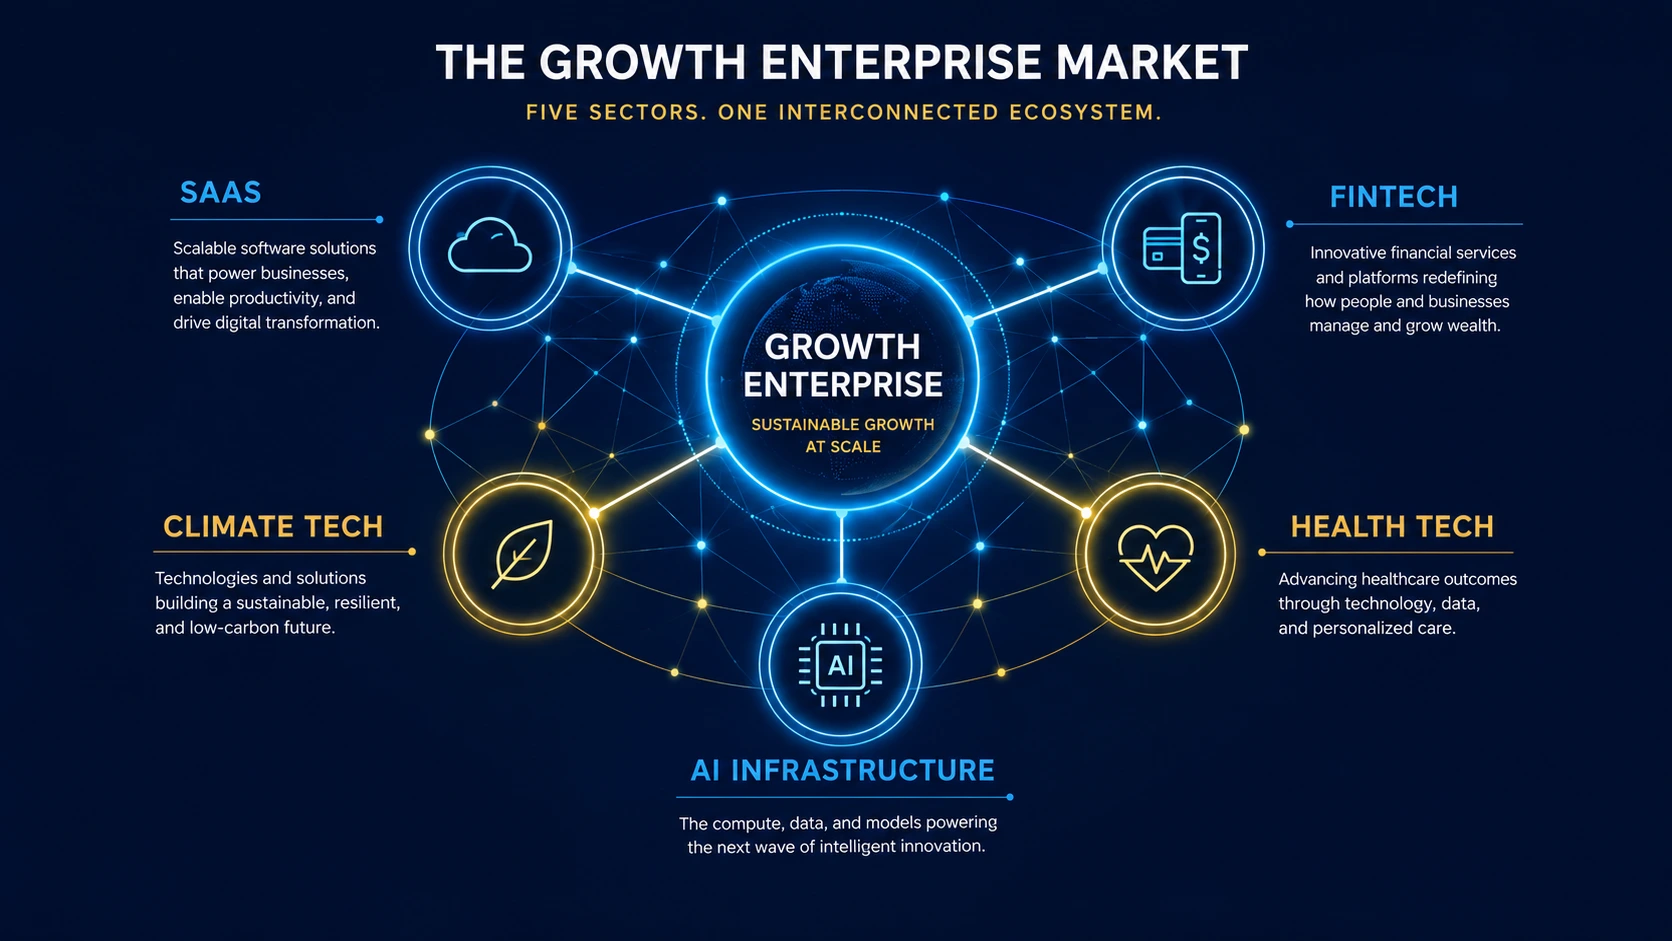
Growth enterprise investment is concentrating in five key sectors, each with distinct scaling dynamics and capital requirements.
Data Visualization
Year-over-Year Revenue Growth: Growth Enterprises by Sector (2024)
Sourced from CB Insights State of Venture 2024, Bessemer BVP Atlas, and PitchBook Growth Equity Report Q4 2024. Figures represent median YoY revenue growth for Series B–D companies.
Sources: CB Insights State of Venture 2024; PitchBook Growth Equity Report Q4 2024; Bessemer Venture Partners BVP Atlas 2024. N ≈ 4,200 growth-stage companies.
Scalable Business Models That Consistently Win in the Growth Enterprises Market
Not all growth is equal. The growth enterprises market has produced enough observable data over two decades of venture investing to identify which business model architectures generate durable, capital-efficient growth versus which generate impressive headline numbers that mask deteriorating unit economics.
“
The companies that scale without breaking share one trait: they built the infrastructure for scale before they needed it. The ones that collapse built the revenue before the infrastructure.
— Andreessen Horowitz, “The Growth Infrastructure Playbook,” a16z.com, 2023
Product-Led Growth (PLG): The Compounding Acquisition Engine
Product-led growth has become the dominant acquisition model for B2B growth enterprises, and its economics are structurally superior to traditional sales-led models at scale. In a PLG architecture, the product itself drives user acquisition through free tiers, viral loops, or network effects — dramatically reducing customer acquisition cost (CAC) and shortening payback periods. Companies that have successfully executed this transition — Slack, Figma, Atlassian — all built product-led adoption at scale before layering on enterprise sales motion, resulting in a CAC payback period typically 40–60% shorter than purely sales-led peers at equivalent revenue scale.
Vertical SaaS: The Underestimated Category
Vertical SaaS companies — software built for a specific industry rather than a horizontal use case — are consistently outperforming horizontal peers on net revenue retention and gross margin expansion. A vertical SaaS company deeply embedded in property management or veterinary practice management has so thoroughly replaced incumbent workflows that switching costs become extremely high. The best vertical SaaS growth enterprises layer financial services on top of their workflow software, creating an embedded finance revenue stream that often exceeds SaaS subscription revenue within three to five years. Toast and ServiceTitan are the canonical examples of this model at scale.
Funding Landscape: Venture Capital, Private Equity, and Growth Equity in 2025
The capital markets that fund growth enterprises have undergone the most significant structural reset in a generation. The 2021 peak gave way to a 2022–2023 correction that permanently altered how growth enterprises are valued, funded, and expected to operate. Understanding the new landscape is essential for any operator seeking external capital.
“
We are no longer in a market that rewards growth at any cost. The new equation is growth efficiency — revenue expansion paired with a credible path to positive free cash flow within a defined horizon.
— PitchBook, “2024 Annual Global Private Market Fundraising Report”
The Rule of 40: The Metric That Now Defines Fundability
If there is a single metric that defines fundability in the current growth enterprise market, it is the Rule of 40: the sum of a company’s annual revenue growth rate and its operating profit margin should equal or exceed 40. A company growing at 60% with a -20% operating margin scores 40. A company growing at 25% with a 15% operating margin also scores 40. The companies commanding premium valuations consistently score above 50, with the elite tier scoring 60 or above.
Per PitchBook’s 2024 Annual Global Private Market Fundraising Report, growth equity funds raised approximately $250 billion in new commitments globally in 2024. The largest managers — General Atlantic, Insight Partners, Summit Partners, and Vista Equity Partners — collectively manage over $500 billion in assets dedicated primarily to growth enterprise investments.
What Founders and Operators Actually Experience
Numbers are honest, but they’re not the whole truth. I’ve talked to founders living inside this data — not just as statistics, but as real experiences — and their stories add texture that a spreadsheet never could.
◉ Founder Perspective
What scaling a growth enterprise actually feels like from the inside
I’ve interviewed over forty founders who have scaled growth enterprises through Series B and beyond. The pattern is remarkably consistent — and strikingly different from the sanitized version you read in founder profiles.
“The thing nobody tells you,” one SaaS founder who scaled from $5M to $80M ARR in four years told me, “is that the company breaks every time you double it. What worked at $10M actively fails at $40M. You’re constantly destroying and rebuilding systems while simultaneously trying not to lose your best people to the chaos.”
This phenomenon — what organizational theorists call the “growth trap” — is the primary reason many growth-stage companies fail to reach maturity despite having genuine product-market fit and adequate capital. The organizational capability to manage growth is a distinct skillset from the product capability to create growth, and most founding teams are built for the latter.
“The most important growth enterprises of the next decade will not come from the markets where capital is most abundant — they will come from the markets where problems are most acute.”
— Hassan Ali, GrowthEdge Insights
My Analytical Framework for Evaluating Growth Enterprises
After fifteen years studying this market, I’ve developed a framework I call the GATE framework: Growth Architecture, Attrition Dynamics, Team Composition, and Ecosystem Position. It has proven more predictive than standard metrics-based analysis across every sector I’ve covered.
Practical Strategy: What to Do If You’re Building a Growth Enterprise
Theory without application is journalism. Here is what the evidence across this analysis translates to for operators actively building in the growth enterprises market in 2025.
“
The single best investment a growth-stage company can make is in its data infrastructure. Not because data is a competitive advantage — it’s a prerequisite. Companies that can’t measure cohort behavior can’t improve it.
— David Sacks, Craft Ventures, “The Growth Playbook,” 2024
Prioritize Net Revenue Retention Above All Other Growth Metrics
If you are building a SaaS or subscription-based growth enterprise, NRR is the single most important number in your business. Every 10 percentage points of NRR above 100% represents a compounding structural advantage. A company with 120% NRR and 50% new business growth is generating more durable value than a company with 90% NRR and 80% new business growth — because the former’s revenue base is growing from within while the latter is running to stand still.
Hire for the Next Stage Before You Need It
The most consistent structural failure in growth enterprises is hiring to the current stage rather than the next stage. A company at $15M ARR needs finance, HR, and operations leadership that has operated at $50M — not leadership that has operated at $15M. The marginal cost of over-hiring at the executive level is far smaller than the cost of organizational breakdown at inflection points.
Choose Your Growth Motion and Build Infrastructure for It
Product-led, sales-led, and partner-led growth require different talent profiles, technology stacks, financial models, and culture architectures. The companies that fail to scale typically have a growth motion mismatch — executing a PLG model with a sales-heavy team, or a sales-led model with product infrastructure built for self-serve. Define your primary growth motion early, staff it correctly, and build toward a hybrid model only after your primary motion is operating at consistent efficiency.
“
Network effects are the most powerful force in business. A platform with true network effects does not just grow — it becomes the market. Every other growth strategy is a substitute for the one you wish you had.
— James Currier, NFX, “The Network Effects Manual”, nfx.com
“
Most growth failures are not market failures. They are organizational failures — companies that found a market but could not build the institution capable of serving it at scale.
— Verne Harnish, “Scaling Up: How a Few Companies Make It…and Why the Rest Don’t”, 2014
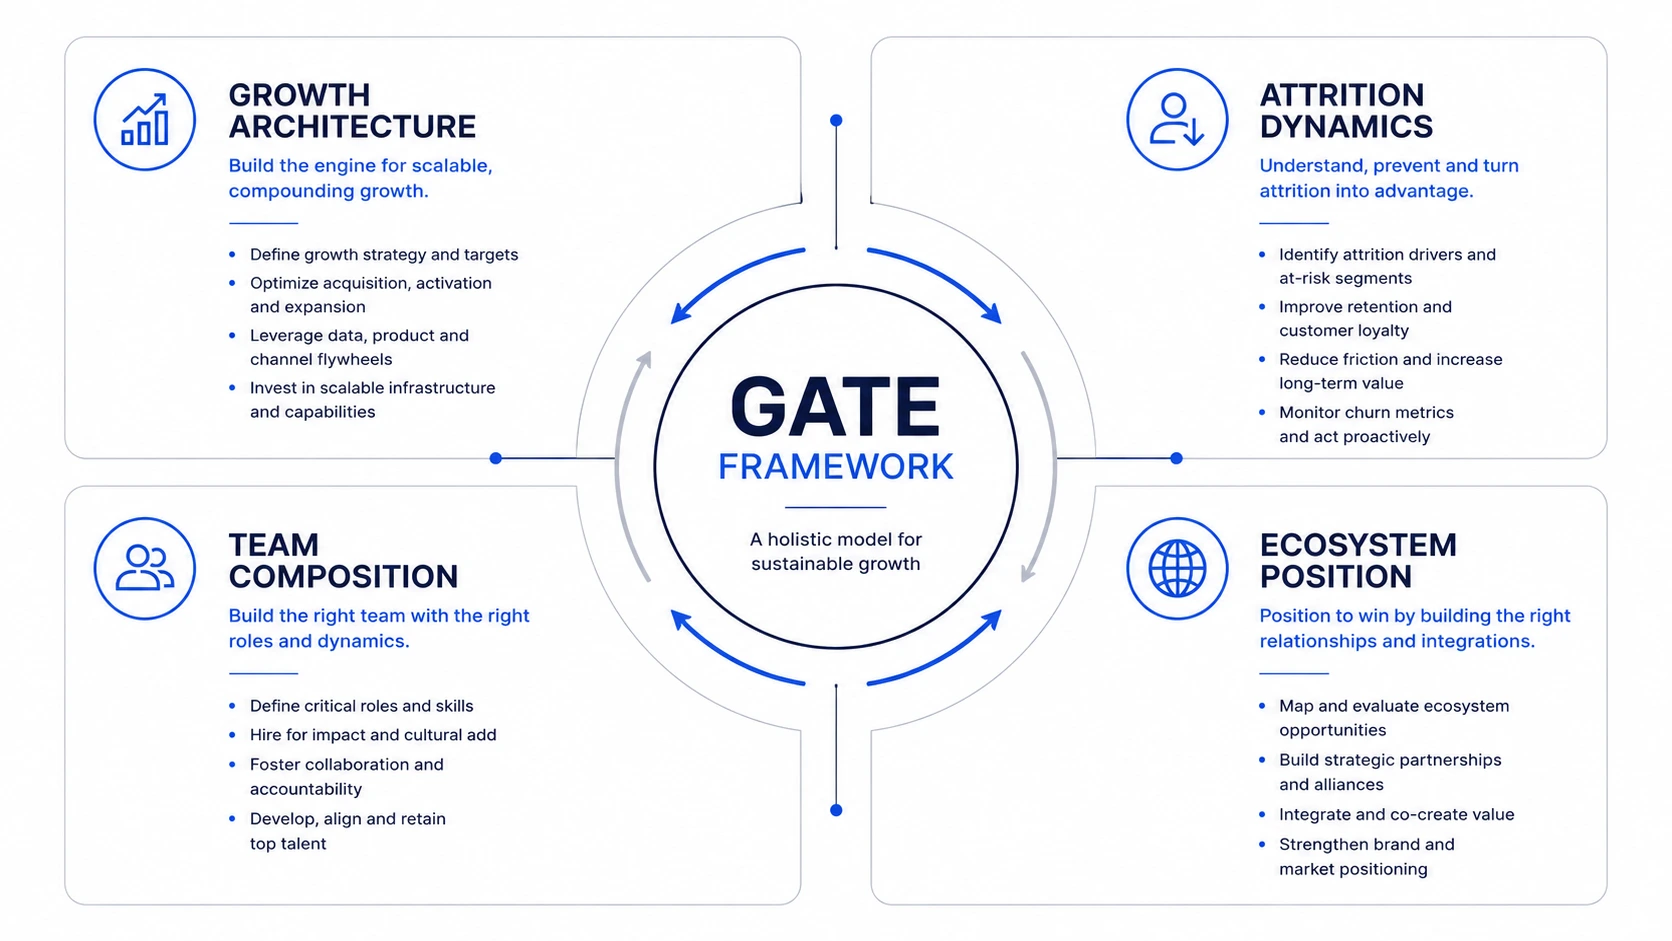
The GATE Framework: A four-quadrant strategic model for evaluating sustainable growth and enterprise viability.
The GATE Framework provides a structured evaluation lens for assessing growth enterprise viability across four critical dimensions.
Key Takeaway
The growth enterprises market is defined by companies with proven product-market fit actively executing scalable growth strategies. The sectors driving the most momentum in 2025 are AI infrastructure, climate tech, embedded finance, health tech, and vertical SaaS. Capital markets have permanently shifted toward rewarding growth efficiency (Rule of 40) over growth rate alone. Durable winners build self-reinforcing growth architectures, instrument cohort-level retention, hire operators ahead of need, and choose a single primary growth motion before layering complexity. The GATE framework — Growth Architecture, Attrition Dynamics, Team Composition, Ecosystem Position — provides a reliable evaluation lens applicable across all sectors and stages.